Water Quality of Otter Lake
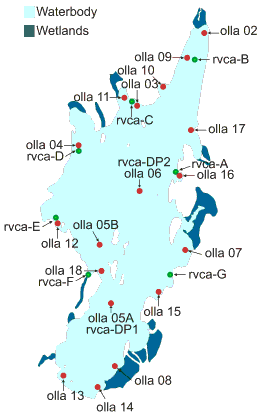 Water quality testing in otter lake has been performed by the Rideau Valley Conservation Authority (RCVA) and the Otter Lake Landowners Association (OLLA) for more than 20 years. The ecological and trophic status of a lake is generally determined by the levels of nutrients it contains and these are what RVCA and OLLA measure at different sites around the lake at least three or four times a year. These test sites are shown on the map on the right. The sites have been chosen to be representative of the whole lake. Some sites are in known deep water points whereas others are in areas where there are known to be inflows into the lake from streams and wetlands. Other sites are in shallow bays where there is an increased tendency for weed and algae growth.
An overview of Factors that Influencing Water Quality
Recreational water quality can most easily be assessedby how clear the water appears. Water clarity is influenced by the amount of soil sediment and phytoplankton, or microscopic algae, present in the water. Clarity is measured by a simple visual test using a Secchi Disk, a 20 centimeter black and white disk attached to a measured line. The disk is then lowered into the lake until it is no longer visible and the depth recorded. More precise information on water quality is gained through analysis of samples for nutrients, specifically bacteria, nitrogen and phosphorus.
All lakes will contain bacteria from the feces of the wildlife that inhabit the lake. Coliform bacteria found in the large intestine of humans and other mammals and are present in soil. While some strains of coliforms do produce toxins, most are not harmful to humans. Some such as Escherichia coli (E. Coli) do produce pathogenic toxins. Therefore levels of E. Coli are often used as indicators of possible contamination by fecal matter and can be an indication of septic pollution. The safe level of E. Coli in a lake for recreation is not more than 100 colony-forming units (cfu) per 100ml of water. E.coli at any level is unacceptable in drinking water.
A variety of chemical elements and compounds are essential to the growth and survival of living organisms. In aquatic ecosystems, nitrogen and phosphorus are the most important, as they are most often in short supply relative to the needs of plants, algae, and microbes. Nitrogen in various forms is an abundant in most aquatic ecosystems. Total Kjeldahl Nitrogen (TKN) which is what is usually measured, determines the concentration of all forms of nitrogen in lakes. TKN in water bodies not influenced by excessive organic inputs such as Otter Lake typically range from 200 to 600 µg/L. Phosphorous is the key element that determines the trophic state of a lake since it is the principle energy source for all living organisms. Therefore phosphorus is the principal limiting factor in the growth of algae, meaning that algae growth will occur in greater amounts as more phosphorus is added to a lake. Phosphorus levels below 10 µg/L are typical of oligotrophic lakes that generally are clear and deep with few nutrients. Phosphorous levels above 20 µg/L are typical of eutrophic lakes that are laden with nutrients which lead to excessive algae and plant growth. Mesotrophic lakes have phosphorous concentrations between these two extremes and are typical of the lakes found in our region of Ontario.
Water Quality data for Otter Lake
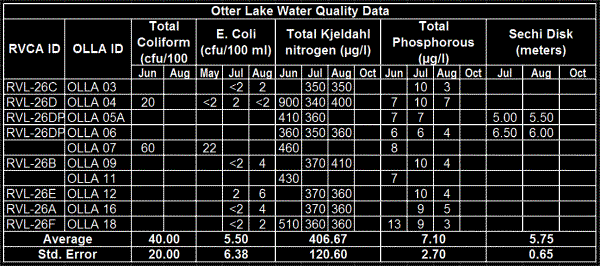 The table on the right shows typical results for water quality testing for Otter Lake. Moderately high Total Coliforms were detectable at sites 04 and 07 in June. These sites are both in locations where there significant inflow streams into the lake and coliforms at this site are not uncommon Low levels of E. coli were also detectable at one of these sites, but were very low or undetectable at all other sites tested in July and August. Total Kjeldahl Nitrogen levels were in the normal range of between 200 - 500 µg/L throughout the Summer except for one site that had a readingof 900 µg/L in June for unknown reasons. Phosphorous levels were all between 3 µg/L and 13 µg/L . Secchi depth readings were generally between 5.5 and 7 meters indicating that the lake remains very clear. Increased water clarity means that sunlight can penetrate deeper and can result in harmless algae blooms over the summer months when the water temperatures is high.
Therefore with a current average phosphorous level of 7 µg/L and an average Secchi depth of almost 6 meters Otter Lake can be classified as oligotrophic. In fact Otter Lake has had total phosphorous levels around or below 10 µg/L for 5 years The graph on the right shows average E Coli, TKN, Phosphorous and Secchi disk values for Otter Lake from data collected over the past 20 years. E Coli levels have always been bellow 5 cfu/100mL, except for an average value of 8 cfu/100mL in 2019. This high value resulted from readings of 30 cfu/100mL at 2 test sites in August and did not repeat in subsequent testing at these sites. However both of these test sites are shoreline sites where there is high residential development. TKN has been relatively constant at around 450 µg/L with a slight downward trend. More significantlytotal phosphorous values have shown a marked downward trend over the past 20 years while Secchi disk readings have shown a significant upward trend. These observations are interestingsince in general, water quality of most lakes in the Rideau Lakes area have been declining over the past 20 years, the water quality in Otter Lake appears to have been improving. The reasons are unknown, however it is possible that Otter Lake's extensive undeveloped wetlands are highly effectively in filtering inflow to the lake or perhaps Otter Lake property owners are being environmentally conscious by limiting use of phosphorous containing detergents and fertilizers.
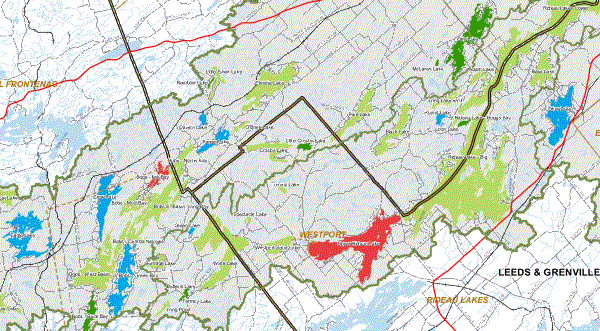 Otter Lake's overall water quality is significantly better than any of the other lakes in the Eastern region of the Rideau Valley watershed as can be seen from the map on the right. As part of it;s Watershed Watch Program RVCA has put together a map of water quality (based on phosphorous levels) of all the lakes in the Rideau valley catchment area that are surveyed annually. Lakes with phosphorous levels of less than 10 µg/L are shown in light blue, 10 - 15 µg/L in light green, 15 - 20 µg/L in dark green and over 20 µg/L in red. As can be seen there are few lakes in light blue and Otter Lake is one of them. Otter lake and Round Lake are the only lakes in light blue in the East. Only Bob's, Crow, Eagle and Farren Lake are also light blue and they are all in the far west of the watershed.
Otter Lake Water Levels
Background
Otter Lake water levels fluctuate significantly during the year. Otter lake has only a single outlet, a culvert on Otter Lake through which the lake empties into Otter creek and several inflow streams. Since the 1960's beavers have been quite active in the upper reaches of Otter Creek. RVCA estimates that there are at least 8 beaver dams between Otter Lake and Lombardy. All of these dams reduce the flow of water in Otter Creek, As a result, the large volume of water resulting from the early spring runoff has a significant effect on the water level in the lake. Water levels are often quite high in the early spring, especially if there has been a rapid spring thaw. These high water levels can cause local flooding to private access roads and low lying properties After the spring runoff is complete the lake level usually drops significantly over the course of a normal summer, with most of the water loss resulting from evaporation and lack of inflow. Water levels often again rise in the fall, when beavers again become active in the creek, however following the freeze over, the lake level will drop during the winter months.
Attempts have been made over the years to control the water levels in otter Lake. "Beaver Bafflers" were installed in the beaver dams in the upper reaches of Otter Creek in an attempt to increasewater flow. A "beaver baffler" is essentially a tube inserted through the base of the beaver dam. However, these bafflers were not successful, primarily because they required continual maintenance. In 2007 the Rideau valley conservation Authority (RVCA) implemented (on a trial basis) a Beaver Management Program in which certain beaver dams in Otter Creek were partially breached in the spring in an attempt to increase water flow following the spring freshet. While the program was partially successful in minimizing spring flooding of low lying areas, the program was expensive to maintain and was discontinued in 2010.
Water Level Monitoring
The Otter Lake Landowners Association (OLLA) and RVCA have accurately measured water levels since 2004. The water level is measured several times a month at the culvert on Otter Lake Road where Otter lake empties into Otter Creek. The graphs below show the water level in Otter Lake from February 2004 to the present. The blue vertical bars represent the monthly mean water level and the vertical bars in red indicate maximum and minimum water levels for each month. The green reference line represents the median water level of 124.81 MASL and the upper reference lines represent RVCA’s estimated 1:2 and 1:100 year flood level respectively.


The graphs clearly indicates how water levels can fluctuate quite dramatically with the seasons. The lowest water level ever recorded was in 2005. In that year water levels were moderately high following the spring freshet, however the lake level dropped almost half a meter between April and September. The summer of 2005 was incredibly hot and dry with virtually no rain in June, July and August. High water levels were experienced in the early spring of 2008 following a winter of excessive snowfall. In April 2008 water levels exceeded RVCA's 1:2 year flood level which would have resulted in some flooding of low lying areas. Water levels were again high in the spring of 2014 and exceeded RVCA's 1:2 year flood level in April. The highest water levels ever recorded were in April and May of 2017, a year in which we had a very wet spring and summer as opposed to 2016 which was hot and dry.
Current Water Levels
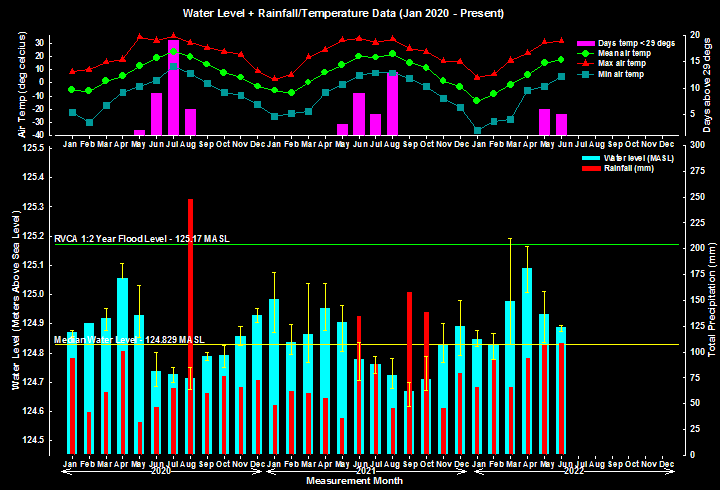 The graph on the right shows the lake level from January 2020 to the present. The vertical bars represent maximum and minimum water levels for each measurement period. The yellow reference line on the graph indicates the median water level of 124.827 MASL and the green reference line represents RVCA’s 1 - 2 year flood level of 125.17 MASL. The graph also includes monthly rainfall and the upper graph shows mean,maximum and minimum air temperature. The vertical bars show the number of days in which the maximum monthly air temperature exceeded 29 degrees celcius. Both rainfall and air temperature can have a significant effect on water levels.
In 2020 the spring freshet was moderate and the spring high water level was in mid April and may have resulted in some minor flooding of low lying properties and some access roads. With little rainfall in May June and July and high temperatures in June and July (28 days with temperatures above 29 degrees) the lake level dropped significantly. However the record high rainfall in August (the last time we had more than 200mm of rain in a single month was in May, 2017) put and end to the drop in water levels and water levels began to rise throughout the remainder of the summer and fall.
The winter of 2020 - 2021 was average with respect to snow storms and our spring freshet was quite gradual throughout March and early April and would not have resulted in much serious flooding. Rainfall in June was higher than usual and slowed down the drop in water levels that usually occurs in July and August. August was the hottest month with 13 days of temperatures above 29 degrees and little rainfall. The 150mm of rain we received in September lead to an increase in water levels which persisted through the winter months. The significant snowfall in 2022 melted slowly throughout March and April and would have resulted in some minor flooding in March. The few days of hot weather in May resulted in drop in water levels, but since there was considerable rainfall in both May and June water levels remained constant and at a considerably higher level than they were this time last year.

